How-to’s, videos, and explanations on everything Excel that you need to know for your business!
Excel can be intimidating. While you might know how to maneuver your way around it, wouldn’t it be great to use it to your business’ advantage? There are certain tools and formulas you can use to let Excel do the calculations and organize the data sets for you. Mastering these Excel skills will make your life easier, allowing you to see data more clearly and accurately, and helping you make important business decisions regarding marketing, merchandising, and more. This Retailer’s Guide To Using Excel will show you the ins and outs of using Excel in collaboration with Endless Aisles, to help your business succeed!
Resources to help you succeed with Excel:
MAP > Retail Price Formula
What: A formula to easily match your retail price to MAP price.
When: If you have MAP violations and you want to update your retail prices in bulk.
How: After downloading the MAP Violations CSV. In cell H2, put =(I2), then drag formula down by double clicking the solid cross in the bottom right corner of the cell H2.
Margin Formula
What: A profit margin formula shows you how much your business is making. In the example below, we’ll be walking through the formula for Product Margin.
When: To help you estimate your earnings and determine if you need to adjust any retail prices.
Example: Download the CSV File from Endless Aisles Price Control, and use this formula in a column to calculate the margin and change retail prices if necessary.
Formula: =(price-cost)/price
Using the Price Control Download use the formula =(H2-J2)/H2
*if you want to see your margin as a percent, highlight the column where you added the formula, then click % on the home toolbar.
Step-by-step guide to margin formulas
VLOOKUP
What: A VLOOKUP is a way to combine separate sets of data into one spreadsheet.
Why: In the example below, to match customer data to line items.
When: Use to merge order history reports and shipped order lines reports.
Example: If you take the order number, and VLOOKUP on the Shipped Order Lines Report, you can get the customer data associated with each line item. This is interesting, because now you see customer purchasing trends. You can now segment your marketing strategy around these insights.
Formula: =VLOOKUP(lookup value, table array, column number, [false])
Using the Shipped Order Lines Report and the Order History Report in column K of the Shipped Order Lines Report use the following formula to get your customer’s name: =VLOOKUP(A2,'order-history-2019-05-24 15_40_'!B:F,5,FALSE)
Step-by-step guide of how to do a VLOOKUP
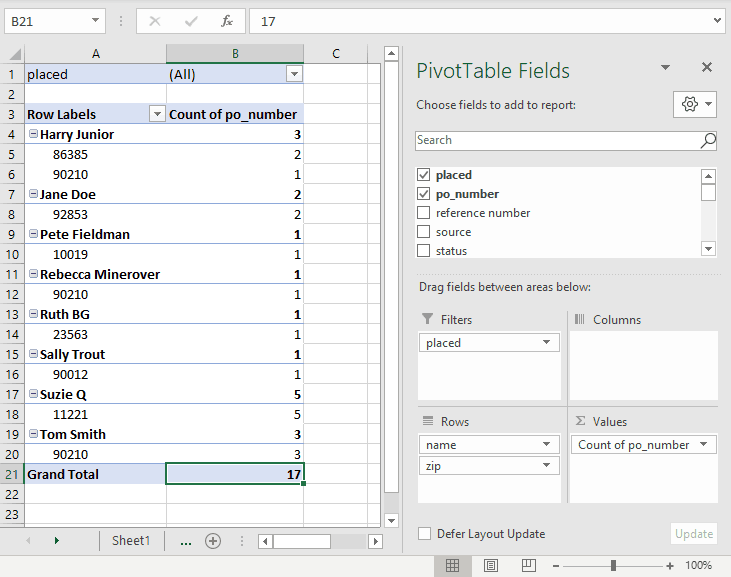
Pivot Tables
What: Pivot tables are used to summarize, sort, or reorganize existing data.
Why: They can help you focus on specifics within your spreadsheet. With pivot tables, you can find information to help you with every facet of your business.
When: To look at high level trends related to your Endless Aisles activity.
Examples:
- To organize revenue, orders, and/or cost by brand or sku using your Shipped Order Lines Report.
- To organize orders by delivery zip code and/or customer, using your Order History Report.

Use this Retailer’s Guide To Excel to learn about features that can help you calculate data and make important decisions for your business.